The diagram shows an industry’s total revenue when different quantities are demanded.
Which values should be inserted at points 1, 2 and 3 to identify the price elasticity of demand (PED) at that position?
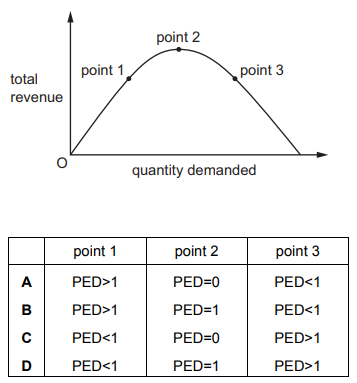
1 )
A
B
3 )
C
4 )
D
تحلیل ویدئویی تست
منتظریم اولین نفر تحلیلش کنه!


پرسش و پاسخ های مشابه
سوال کنید یا به سوالات دیگران پاسخ دهید ...