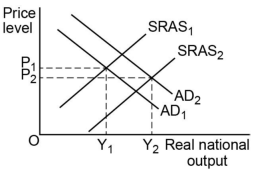
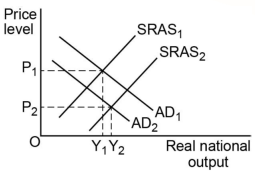
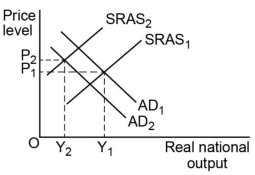
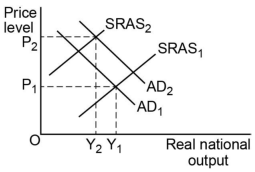
The diagrams below show the aggregate demand (AD) and short run aggregate supply (SRAS) curves for an economy. AD$_1$ and SRAS$_1$ show the initial positions of the curves and AD$_2$ and SRA$S$_2$ the new positions.
Which one of the following diagrams, A, B, C or D, illustrates a fall in world commodity prices as well as a fall in government spending?
1 )
3 )
4 )
تحلیل ویدئویی تست
منتظریم اولین نفر تحلیلش کنه!


پرسش و پاسخ های مشابه
سوال کنید یا به سوالات دیگران پاسخ دهید ...