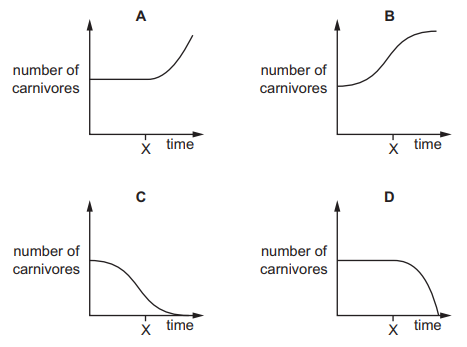
The graphs show the number of carnivores in a habitat over a period of time. At time X the herbivores in their food chain are removed from the habitat.
Which graph shows the effect of this on the number of carnivores?
1 )
A
2 )
B
3 )
C
D
تحلیل ویدئویی تست
تحلیل ویدئویی برای این تست ثبت نشده است!


پرسش و پاسخ های مشابه
سوال کنید یا به سوالات دیگران پاسخ دهید ...