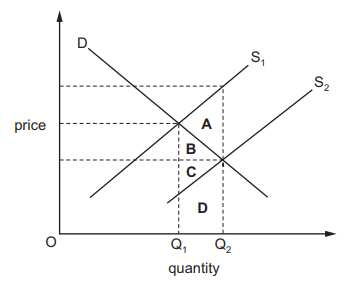
The diagram shows the supply and demand curves of a commodity.
A government subsidy causes the supply curve to shift from S1 to S2.
Which area measures the difference between the cost to the economy of producing the resulting increase in output (${Q_1}-{Q_2}$) and the value consumers place on this increase in output?
A
2 )
B
3 )
C
4 )
D
تحلیل ویدئویی تست
منتظریم اولین نفر تحلیلش کنه!