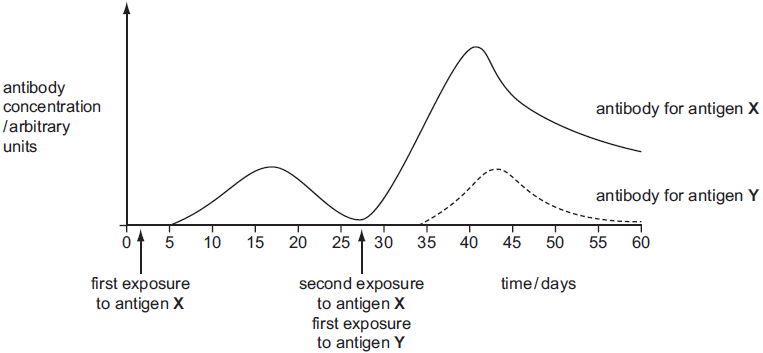
In an investigation into the immune response, a volunteer was exposed to two different antigens, X and Y.
The relative antibody concentration in the blood was measured at regular intervals over 60 days.
The graph shows the time when the volunteer was exposed to each antigen and the antibody concentration against time for antigens X and Y.
What is the explanation for the results displayed on the graph?
1 )
A primary and secondary immune response against antigen X occurred, with the memory B-lymphocytes inhibiting the secondary immune response against antigen Y.
2 )
A primary immune response to antigen Y occurred and memory B-lymphocytes specific to antigen Y enhanced the secondary immune response to antigen X.
Memory B-lymphocytes specific to antigen X enabled a secondary immune response to occur; different B-lymphocytes were activated for a primary immune response for antigen Y.
4 )
Plasma cells remaining from the first exposure to antigen X undergo rapid clonal selection to produce high levels of antibody against antigen X and lower levels of antibody against antigen Y.
تحلیل ویدئویی تست
منتظریم اولین نفر تحلیلش کنه!


پرسش و پاسخ های مشابه
سوال کنید یا به سوالات دیگران پاسخ دهید ...