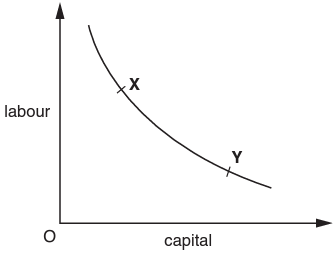
In the diagram, the curve shows the various combinations of labour and capital that can be employed to produce a given volume of output.
A firm initially chooses the combination of labour and capital shown by point X on the curve. In a subsequent period the firm chooses the combination of labour and capital shown by point Y.
What could explain this change?
1 )
a decrease in capital productivity
2 )
an increase in labour productivity
an increase in the cost of labour
4 )
an increase in the cost of capital
تحلیل ویدئویی تست
منتظریم اولین نفر تحلیلش کنه!


پرسش و پاسخ های مشابه
سوال کنید یا به سوالات دیگران پاسخ دهید ...