In the diagram, D$_1$ shows an individual’s initial demand curve for public transport.
What could cause the demand curve to shift to D$_2$?
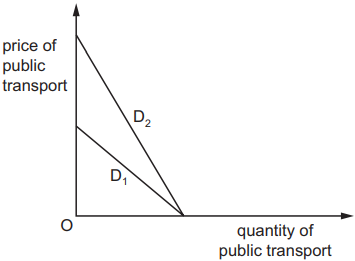
1 )
The costs of running the individual’s car fall.
The individual is no longer able to drive.
3 )
The price of public transport falls.
4 )
The public transport services are reduced.
تحلیل ویدئویی تست
منتظریم اولین نفر تحلیلش کنه!


پرسش و پاسخ های مشابه
سوال کنید یا به سوالات دیگران پاسخ دهید ...