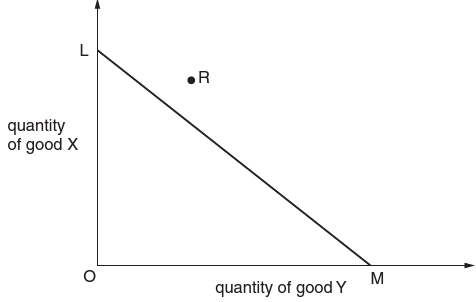
In the diagram LM is the production possibility curve of a country that has a comparative advantage in the production of good Y.
What might enable the country to consume the quantities of X and Y indicated by point R?
1 )
increased specialisation in the production of good X
international trade
3 )
a reduction in unemployment
4 )
increased specialisation in the production of good Y
تحلیل ویدئویی تست
منتظریم اولین نفر تحلیلش کنه!


پرسش و پاسخ های مشابه
سوال کنید یا به سوالات دیگران پاسخ دهید ...