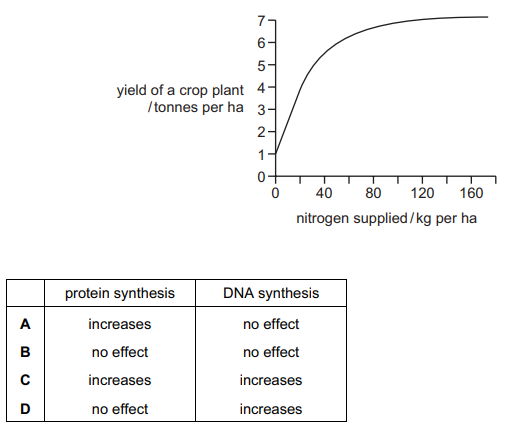
The growth of crop plants is often limited by the availability of nitrogen in the soil.
The graph shows the results of an investigation into the yield of a crop plant, with increasing levels of nitrogen supplied.
Which of the following best explains the shape of this curve?
1 )
A
2 )
B
C
4 )
D
تحلیل ویدئویی تست
منتظریم اولین نفر تحلیلش کنه!


پرسش و پاسخ های مشابه
سوال کنید یا به سوالات دیگران پاسخ دهید ...