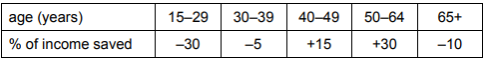
The table shows the percentage (%) of income saved by different age groups.
What can be concluded from the table?
1 )
Over the age range shown total savings equalled total dissavings.
2 )
The 15–29 age group has the lowest level of income.
The 50–64 age group saves the highest percentage of its income.
4 )
The 65+ age group has a lower income than the 30–39 age group.
تحلیل ویدئویی تست
تحلیل ویدئویی برای این تست ثبت نشده است!


پرسش و پاسخ های مشابه
سوال کنید یا به سوالات دیگران پاسخ دهید ...