The diagram shows shifts in an economy’s production possibility curve.
Which change could have come about as a result of an improvement in technology?
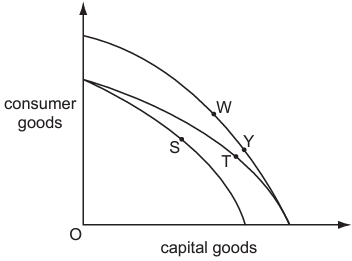
S to Y
2 )
T to S
3 )
W to T
4 )
W to Y
تحلیل ویدئویی تست
منتظریم اولین نفر تحلیلش کنه!


پرسش و پاسخ های مشابه
سوال کنید یا به سوالات دیگران پاسخ دهید ...