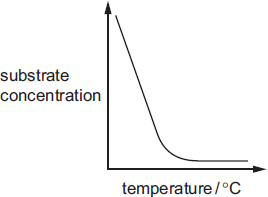
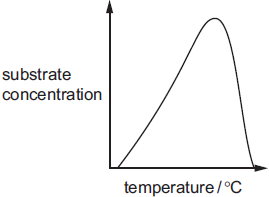
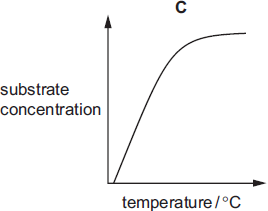
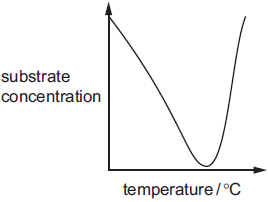
A student carried out an investigation into the effect of temperature on the rate of an enzyme-catalysed reaction.
At each temperature, the substrate concentration was measured after 10 minutes. All the other variables were kept constant.
Which graph shows the effect of increasing temperature on the substrate concentration after 10 minutes?
1 )
2 )
3 )
تحلیل ویدئویی تست
منتظریم اولین نفر تحلیلش کنه!


پرسش و پاسخ های مشابه
سوال کنید یا به سوالات دیگران پاسخ دهید ...