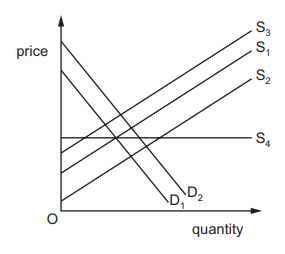
The diagram shows the demand curve, ${D_1}$, and the supply curve, ${S_1}$, for a good.
The government decides to pay producers a specific subsidy for each unit supplied to the market.
Which curve shows the new effective demand or supply curve?
1 )
${D_2}$
${S_2}$
3 )
${S_3}$
4 )
${S_4}$
تحلیل ویدئویی تست
منتظریم اولین نفر تحلیلش کنه!


پرسش و پاسخ های مشابه
سوال کنید یا به سوالات دیگران پاسخ دهید ...