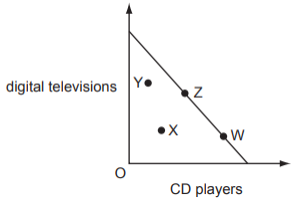
The diagram shows a production possibility curve for digital televisions and CD players.
Which movement shows an increase in the use of existing resources to increase production for both digital televisions and CD players?
1 )
X to W
X to Z
3 )
Z to W
4 )
Z to Y
تحلیل ویدئویی تست
تحلیل ویدئویی برای این تست ثبت نشده است!


پرسش و پاسخ های مشابه
سوال کنید یا به سوالات دیگران پاسخ دهید ...