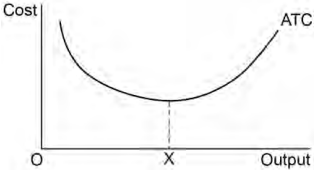
The diagram below shows a firm’s average total cost curve (ATC), with the firm producing an output of OX.
The firm’s productive efficiency will improve if the
1 )
ATC curve shifts upwards for any given level of output.
ATC curve shifts downwards for any given level of output.
3 )
firm increases its level of output.
4 )
firm reduces its level of output.
تحلیل ویدئویی تست
منتظریم اولین نفر تحلیلش کنه!


پرسش و پاسخ های مشابه
سوال کنید یا به سوالات دیگران پاسخ دهید ...