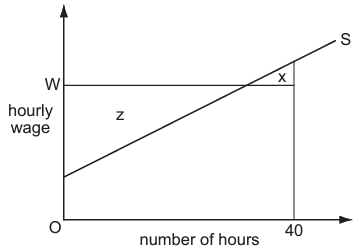
The diagram shows an individual worker’s supply curve of labour.
The hourly wage is OW and the worker is required to work a standard 40-hour week.
Which area measures the difference between the total amount the worker is paid per week and the minimum amount he would be willing to accept?
1 )
x
2 )
z
3 )
x + z
z – x
تحلیل ویدئویی تست
منتظریم اولین نفر تحلیلش کنه!


پرسش و پاسخ های مشابه
سوال کنید یا به سوالات دیگران پاسخ دهید ...