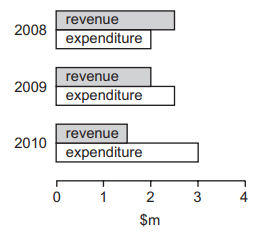
The diagram shows a government’s revenue and expenditure for three years.
What can be concluded from the diagram?
 
            1 )
A budget deficit was replaced by a budget surplus.
A government borrowing requirement emerged.
3 )
The economy moved from a recession into a boom period.
4 )
The yield from taxation continuously increased.
تحلیل ویدئویی تست
منتظریم اولین نفر تحلیلش کنه!


                                                    