The diagram shows three production possibility curves (PPC) for a country, labelled 3, 2 and 1. The original PPC for the country is 2.
This country experiences a fall in its working population and then this is followed by a long period of recession.
If an increase in GDP then takes place, what is the increase in production?
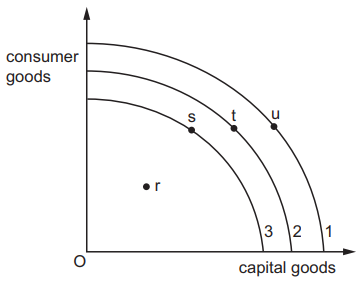
r to s
2 )
r to u
3 )
s to t
4 )
t to u
تحلیل ویدئویی تست
منتظریم اولین نفر تحلیلش کنه!


پرسش و پاسخ های مشابه
سوال کنید یا به سوالات دیگران پاسخ دهید ...