The diagram shows rates of inflation as measured by the Consumer Price Index (CPI) between 1997 and 2004.
Which conclusion can be drawn from this data?
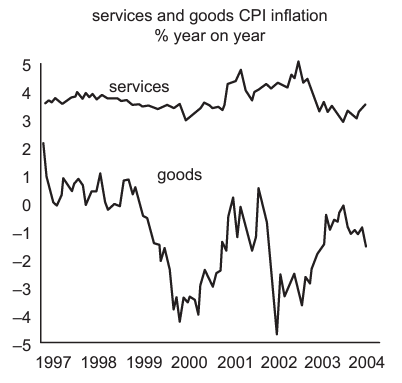
The prices of goods fell in 1999.
2 )
The prices of goods rose between 2000 and 2001.
3 )
The prices of services fell between 2002 and 2004.
4 )
Between 1997 and 2004, services cost more than goods.
تحلیل ویدئویی تست
منتظریم اولین نفر تحلیلش کنه!


پرسش و پاسخ های مشابه
سوال کنید یا به سوالات دیگران پاسخ دهید ...