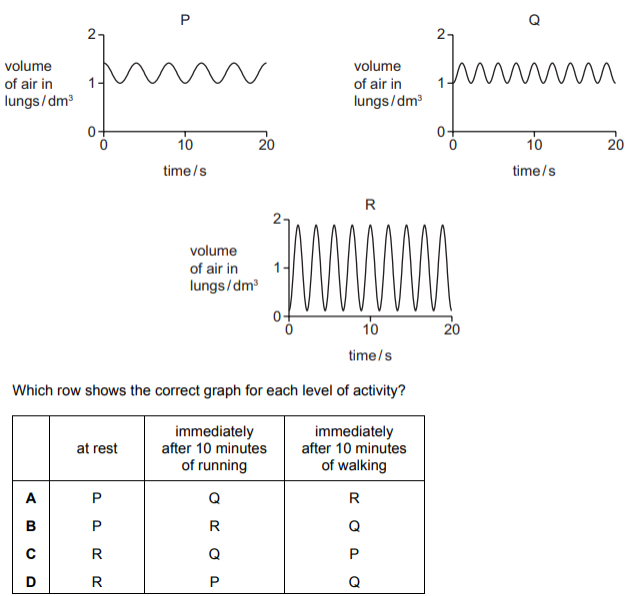
The graphs P, Q and R show the changes in the volume of air in the lungs of the same person, measured after different levels of activities.
Which row shows the correct graph for each level of activity?
1 )
A
B
3 )
C
4 )
D
تحلیل ویدئویی تست
منتظریم اولین نفر تحلیلش کنه!


پرسش و پاسخ های مشابه
سوال کنید یا به سوالات دیگران پاسخ دهید ...