In the diagram, the demand and supply curves for wheat in Australia are shown. Initial equilibrium is at X. The government imposes a sales tax on wheat at the same time as increasing the rate of income tax.
Which point could represent the new equilibrium?
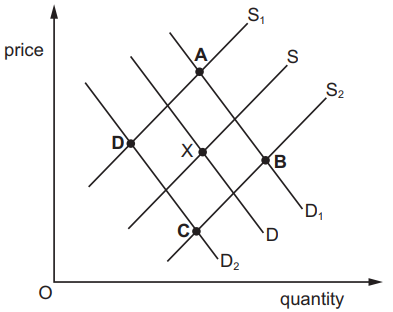
1 )
A
2 )
B
3 )
C
D
تحلیل ویدئویی تست
منتظریم اولین نفر تحلیلش کنه!


پرسش و پاسخ های مشابه
سوال کنید یا به سوالات دیگران پاسخ دهید ...