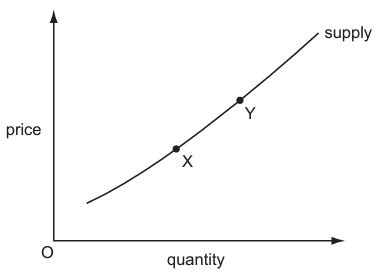
The diagram shows the supply curve of coffee in an economy.
The market equilibrium is initially at point X, but a change moves it to point Y.
What might explain this?
1 )
an increase in wages paid by producers of coffee
2 )
a switch in consumer tastes from coffee to tea
an increase in the price of tea
4 )
a tax imposed on coffee producers
تحلیل ویدئویی تست
منتظریم اولین نفر تحلیلش کنه!


پرسش و پاسخ های مشابه
سوال کنید یا به سوالات دیگران پاسخ دهید ...