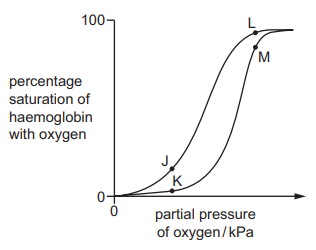
The graph shows the percentage saturation of haemoglobin with oxygen at a range of partial pressures of oxygen and at two partial pressures of carbon dioxide.
One curve is at the partial pressure of carbon dioxide in the lungs and the other curve at the partial pressure of carbon dioxide in the liver.
Which points on the curves correspond to the percentage saturation of haemoglobin at the lungs and at the liver?
1 )
L and J
L and K
3 )
M and J
4 )
M and K
تحلیل ویدئویی تست
منتظریم اولین نفر تحلیلش کنه!


پرسش و پاسخ های مشابه
سوال کنید یا به سوالات دیگران پاسخ دهید ...