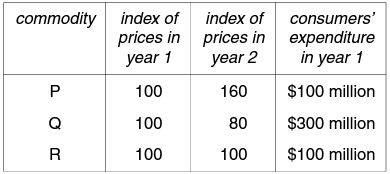
The table shows information about a country whose consumers spend their income on three commodities, P, Q and R.
Between year 1 and year 2 how has the general level of prices changed?
1 )
It has risen by 40%.
2 )
It has risen by 10%.
It has remained the same.
4 )
It has fallen by 5%.
تحلیل ویدئویی تست
منتظریم اولین نفر تحلیلش کنه!


