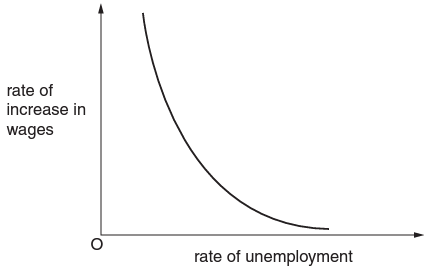
The diagram shows the relationship between the rate of increase in wages and the rate of unemployment.
Which of the following would be likely to cause the curve in the diagram to shift upwards and to the right?
1 )
a reduction in regional differences in unemployment rates
2 )
a reduction in the proportion of the workforce belonging to trade unions
3 )
an increase in the unemployment rate
the expectation of a higher rate of inflation
تحلیل ویدئویی تست
منتظریم اولین نفر تحلیلش کنه!


پرسش و پاسخ های مشابه
سوال کنید یا به سوالات دیگران پاسخ دهید ...