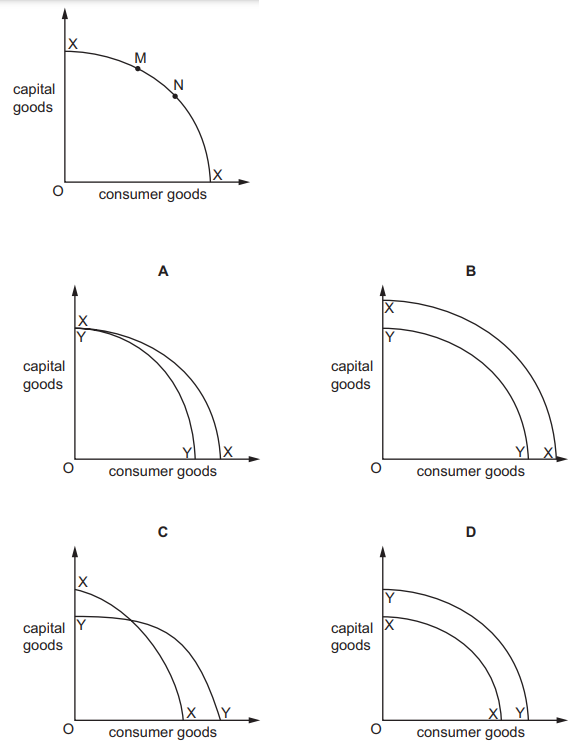
The diagram shows the production possibility curve XX of an economy that produces both consumer goods and capital goods.
If the economy moves from point M to point N, which diagram represents the most likely position of the production possibility curve YY in the future?
1 )
A
B
3 )
C
4 )
D
تحلیل ویدئویی تست
منتظریم اولین نفر تحلیلش کنه!


پرسش و پاسخ های مشابه
سوال کنید یا به سوالات دیگران پاسخ دهید ...