The diagram shows ${S_1}$ and ${D_1}$, the original supply and demand curves for fast food in an economy. Point X is the original equilibrium. Fast food is an inferior good.
What would be the new equilibrium position following a tax imposed on fast food and a fall in real income?
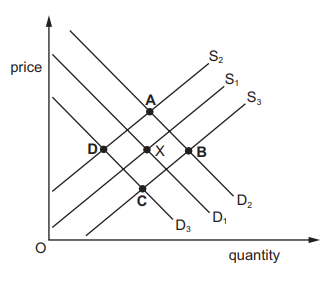
A
2 )
B
3 )
C
4 )
D
تحلیل ویدئویی تست
منتظریم اولین نفر تحلیلش کنه!


پرسش و پاسخ های مشابه
سوال کنید یا به سوالات دیگران پاسخ دهید ...