The diagram shows the production possibility curve (PPC) of a country producing at point T.
The country has an ageing population and decides to allocate more resources to the production of health services.
Which movement shows this change in resource allocation?
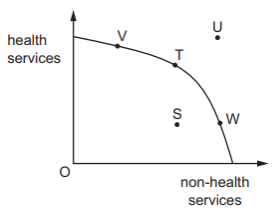
1 )
T to S
2 )
T to U
T to V
4 )
T to W
تحلیل ویدئویی تست
تحلیل ویدئویی برای این تست ثبت نشده است!


پرسش و پاسخ های مشابه
سوال کنید یا به سوالات دیگران پاسخ دهید ...