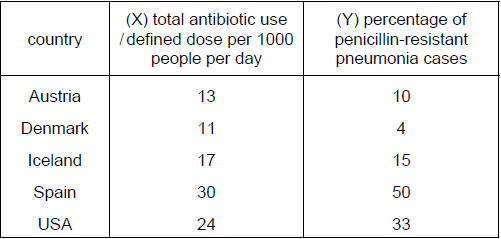
The table compares total antibiotic use (X) and the percentage of antibiotic-resistant pneumonia cases (Y) in five countries.
What is supported by the data?
1 )
When X decreases there is an increase in Y.
When X increases there is an increase in Y.
3 )
When X increases it causes an increase in Y.
4 )
There is no relationship between X and Y.
تحلیل ویدئویی تست
منتظریم اولین نفر تحلیلش کنه!


پرسش و پاسخ های مشابه
سوال کنید یا به سوالات دیگران پاسخ دهید ...