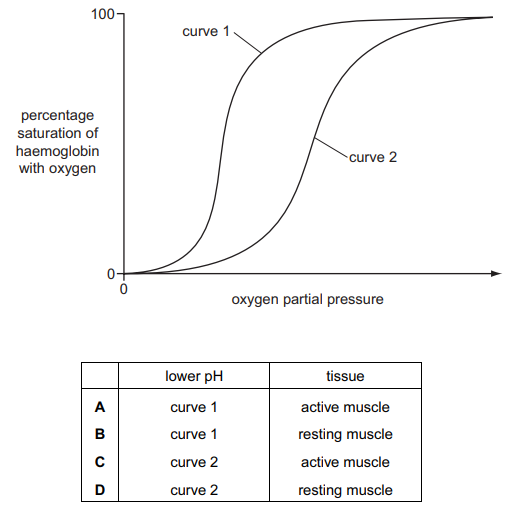
The graph shows the dissociation of oxygen from haemoglobin at two different pHs.
Which curve represents the lower pH and in which tissue might the data have been recorded?
1 )
A
2 )
B
C
4 )
D
تحلیل ویدئویی تست
منتظریم اولین نفر تحلیلش کنه!


پرسش و پاسخ های مشابه
سوال کنید یا به سوالات دیگران پاسخ دهید ...