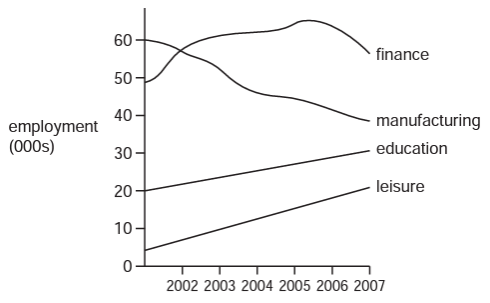
The diagram shows changes in the numbers employed in four different industries in a city between 2002 and 2007.
What can be concluded from the diagram?
1 )
Finance was always the largest employer.
Leisure had the fastest growth rate in employment.
3 )
Manufacturing was the only industry to show signs of decline.
4 )
Total employment in the four industries decreased over the period.
تحلیل ویدئویی تست
تحلیل ویدئویی برای این تست ثبت نشده است!


پرسش و پاسخ های مشابه
سوال کنید یا به سوالات دیگران پاسخ دهید ...