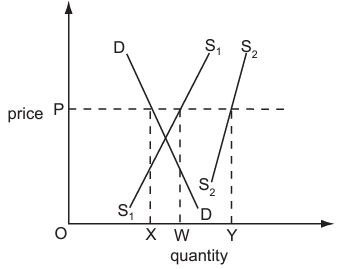
In the diagram S1S1 and ${S_1}{S_1}$ are the supply curves for an agricultural product in years 1 and 2 respectively. DD is the demand curve in years 1 and 2.
In year 1 the government purchases an amount necessary to ensure that the price is at the level OP.
If the price is to be held at OP in year 2, how much must the government buy?
1 )
OY
2 )
XW
3 )
WY
XY
تحلیل ویدئویی تست
منتظریم اولین نفر تحلیلش کنه!


پرسش و پاسخ های مشابه
سوال کنید یا به سوالات دیگران پاسخ دهید ...