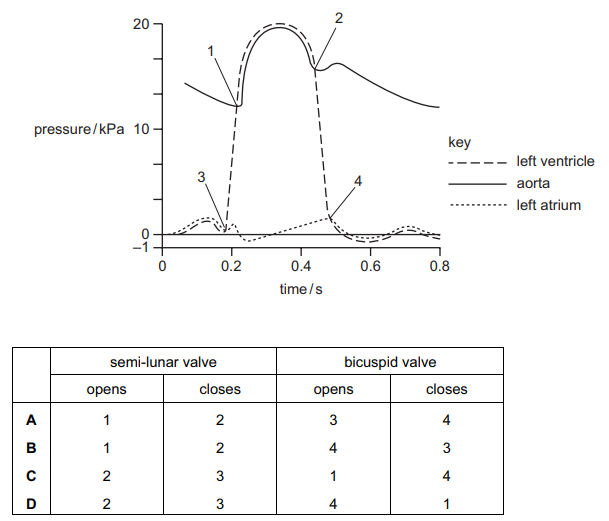
The following graph shows the pressure changes in the left atrium, left ventricle and aorta during a cardiac cycle.
With reference to the semilunar and bicuspid valves, what is happening at points 1, 2, 3 and 4?
1 )
A
B
3 )
C
4 )
D
تحلیل ویدئویی تست
منتظریم اولین نفر تحلیلش کنه!


پرسش و پاسخ های مشابه
سوال کنید یا به سوالات دیگران پاسخ دهید ...