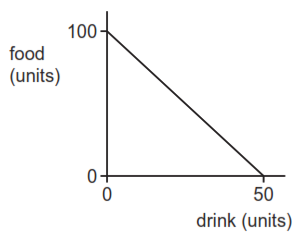
The diagram shows a country’s production possibility curve.
What can be concluded from the diagram?
1 )
Food and drink are normal goods.
2 )
The country is self-sufficient in the production of food and drink.
3 )
The opportunity cost of food falls as more drink is produced.
There is a constant opportunity cost between food and drink.
تحلیل ویدئویی تست
منتظریم اولین نفر تحلیلش کنه!


پرسش و پاسخ های مشابه
سوال کنید یا به سوالات دیگران پاسخ دهید ...