The diagram shows two production possibility curves (EF and GH), before and after technological progress has taken place.
After technological progress has taken place, what is the opportunity cost in capital goods of producing OX consumer goods?
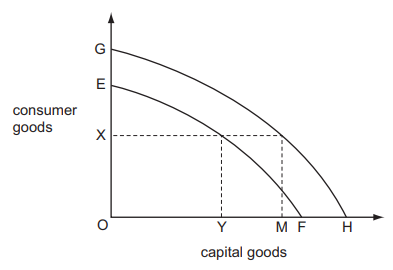
MH
2 )
OH
3 )
OM
4 )
YF
تحلیل ویدئویی تست
منتظریم اولین نفر تحلیلش کنه!


پرسش و پاسخ های مشابه
سوال کنید یا به سوالات دیگران پاسخ دهید ...