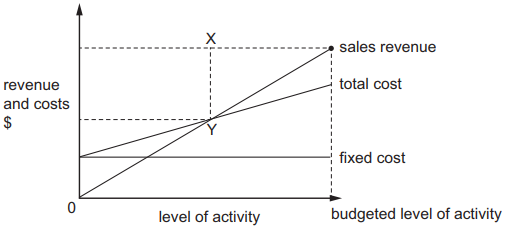
The diagram shows a break-even chart.
What does line XY represent?
1 )
the break-even point revenue
the margin of safety in terms of revenue
3 )
the profit at break-even point
4 )
the total contribution at break-even point
تحلیل ویدئویی تست
منتظریم اولین نفر تحلیلش کنه!


پرسش و پاسخ های مشابه
سوال کنید یا به سوالات دیگران پاسخ دهید ...