A country was at point P on its production possibility curve. Following the threat of invasion it prepared for war. The war then reduced the country’s infrastructure.
What are the most likely changes on the production possibility curve diagram that are consistent with these events?
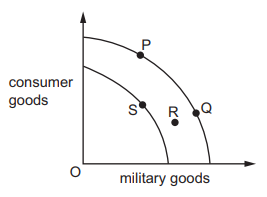
1 )
P to Q followed by Q to R
P to Q followed by Q to S
3 )
P to R followed by R to Q
4 )
P to R followed by R to S
تحلیل ویدئویی تست
منتظریم اولین نفر تحلیلش کنه!


پرسش و پاسخ های مشابه
سوال کنید یا به سوالات دیگران پاسخ دهید ...