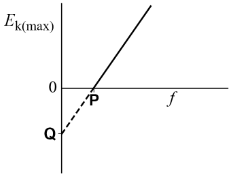
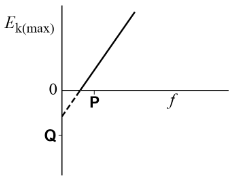
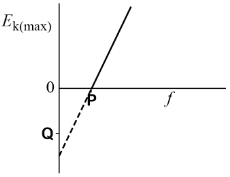
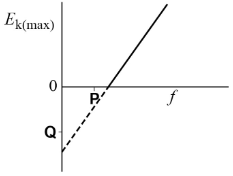
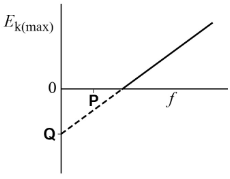
The graph shows how the maximum kinetic energy E$_{k(max)}$ of photoelectrons emitted from a metal surface varies with the frequency f of the incident radiation. P is the intercept on the f axis. Q is the intercept on the E$_{k(max)}$ axis.
Which graph shows the variation of E$_{k(max)}$ with f for a metal with a greater work function?
1 )
2 )
4 )
تحلیل ویدئویی تست
منتظریم اولین نفر تحلیلش کنه!


پرسش و پاسخ های مشابه
سوال کنید یا به سوالات دیگران پاسخ دهید ...