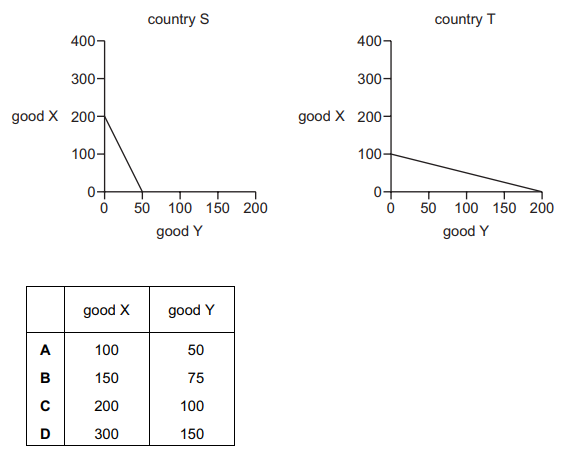
The diagram illustrates the production possibility curves for countries S and T producing goods X and Y.
Countries S and T specialise in the product for which they have the lower opportunity cost. They trade with each other at the rate of two good X for one good Y.
What is a possible combination of goods for country S to consume after specialisation and trade have taken place?
A
2 )
B
3 )
C
4 )
D
تحلیل ویدئویی تست
منتظریم اولین نفر تحلیلش کنه!


پرسش و پاسخ های مشابه
سوال کنید یا به سوالات دیگران پاسخ دهید ...