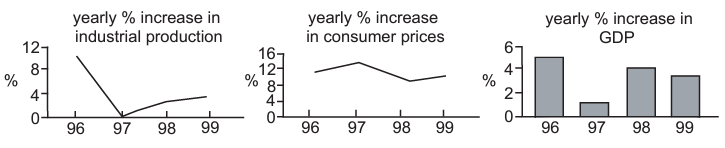
The graphs indicate economic performance in a country between 1996 and 1999.
Which conclusion may be drawn from the graphs?
1 )
Between 1996 and 1997 industrial production and GDP fell but prices rose.
2 )
Between 1997 and 1998 the rates of growth of industrial production, GDP and prices all increased.
3 )
GDP and industrial production were at their lowest in 1997.
At no time did industrial production, GDP or prices fall.
تحلیل ویدئویی تست
منتظریم اولین نفر تحلیلش کنه!


پرسش و پاسخ های مشابه
سوال کنید یا به سوالات دیگران پاسخ دهید ...