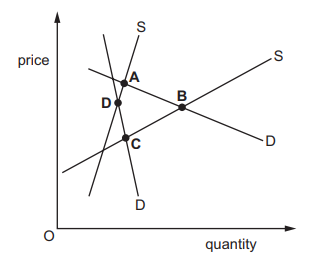
The diagram shows two demand curves and two supply curves for a product.
Which equilibrium point is most likely to represent the long-run equilibrium in the market?
1 )
A
B
3 )
C
4 )
D
تحلیل ویدئویی تست
منتظریم اولین نفر تحلیلش کنه!


پرسش و پاسخ های مشابه
سوال کنید یا به سوالات دیگران پاسخ دهید ...