The diagram shows the market for milk. Two conditions change. The cost of cattle feed rises sharply and this is followed by the government raising the tax on cheese which uses milk in its production.
Which changes in position on the diagram of demand curves for milk are consistent with these events?
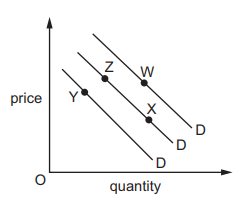
1 )
from W to X, followed by X to Z
2 )
from W to Z, followed by Z to X
from X to Z, followed by Z to Y
4 )
from Z to X, followed by X to Y
تحلیل ویدئویی تست
منتظریم اولین نفر تحلیلش کنه!


پرسش و پاسخ های مشابه
سوال کنید یا به سوالات دیگران پاسخ دهید ...