The diagram below shows the market demand curve (D) and two market supply (S$_1$ and S$_2$) curves for a good. The initial equilibrium point is at E$_1$. The introduction by the government of an indirect tax per unit of the good results in a new equilibrium at E$_2$.
The amount of the indirect tax per unit is measured by the
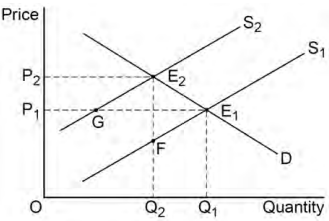
vertical distance FE$_2$.
2 )
increase in price P$_1$P$_2$.
3 )
the diagonal distance E$_1$E$_2$.
4 )
the horizontal distance GE$_1$.
تحلیل ویدئویی تست
منتظریم اولین نفر تحلیلش کنه!


پرسش و پاسخ های مشابه
سوال کنید یا به سوالات دیگران پاسخ دهید ...