The table shows the percentage of the working population in different sectors in three countries.
What can be concluded from the table?
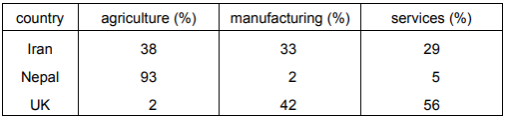
1 )
Iran has fewer people working in the secondary sector than the UK.
2 )
Nepal is a developed economy.
The tertiary sector is more developed in Iran than in Nepal.
4 )
The UK is dependent on the primary sector.
تحلیل ویدئویی تست
منتظریم اولین نفر تحلیلش کنه!


پرسش و پاسخ های مشابه
سوال کنید یا به سوالات دیگران پاسخ دهید ...