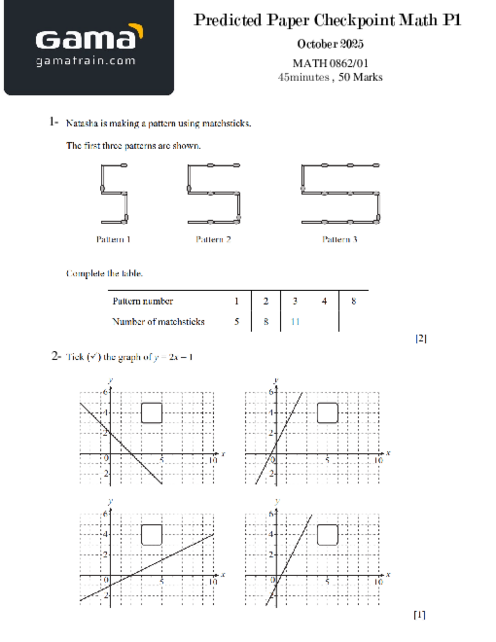
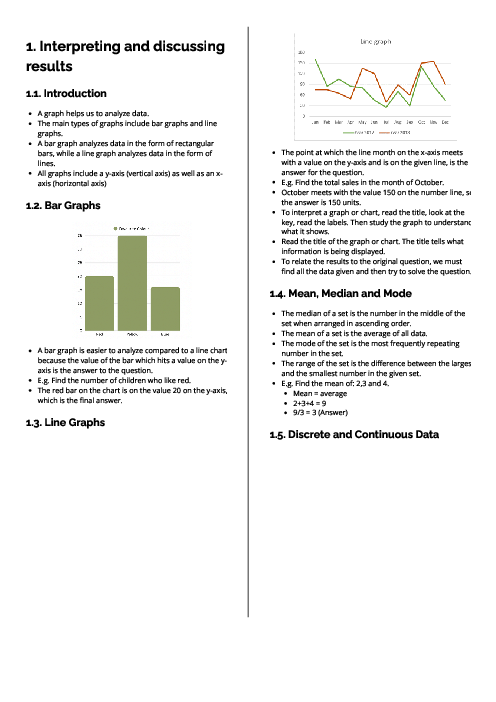
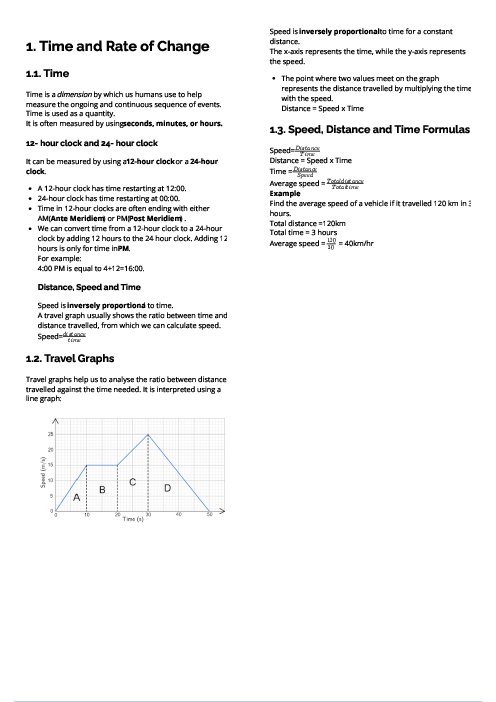
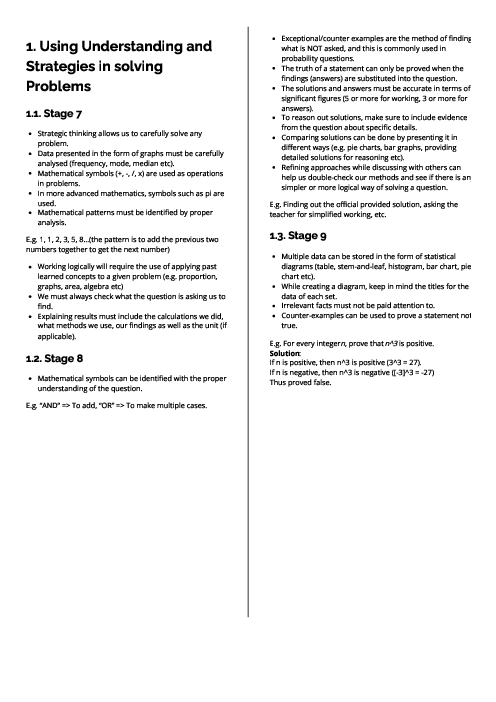
A teacher wants to show the distribution of ages in a class of 30 students. The data includes individual ages from 10 to 15 years. Which statistical diagram is most appropriate?
1 )
Pie chart
2 )
Bar graph
3 )
Line graph
Stem-and-leaf diagram
تحلیل ویدئویی تست
منتظریم اولین نفر تحلیلش کنه!


