The graph shows the movement of the £ sterling against the US$ over a three-month period in 2013.
What could explain this change?
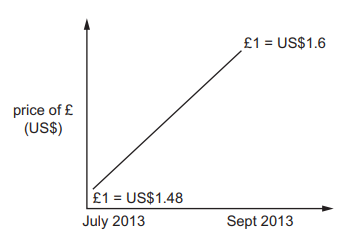
an increase in confidence about the UK economy
2 )
an increase in productivity in the US
3 )
an increase in UK Government debt
4 )
an increase in US interest rates
تحلیل ویدئویی تست
منتظریم اولین نفر تحلیلش کنه!


پرسش و پاسخ های مشابه
سوال کنید یا به سوالات دیگران پاسخ دهید ...