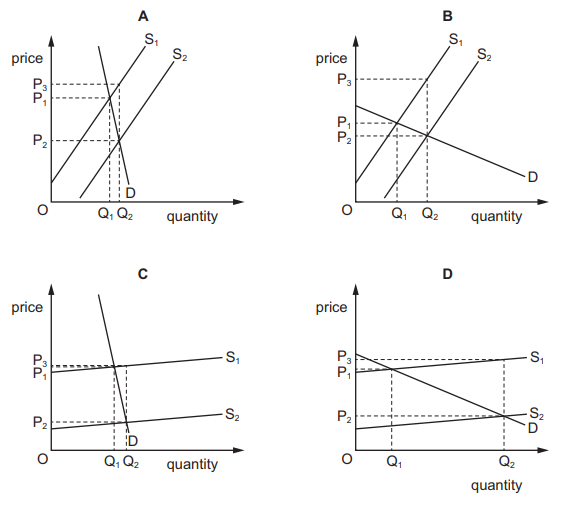
In each diagram the initial supply is ${S_1}$ and the new supply after subsidy is ${S_2}$. The subsidy is identical in each case.
Which diagram shows the greatest incidence of the subsidy on the consumers?
1 )
A
2 )
B
C
4 )
D
تحلیل ویدئویی تست
منتظریم اولین نفر تحلیلش کنه!


پرسش و پاسخ های مشابه
سوال کنید یا به سوالات دیگران پاسخ دهید ...