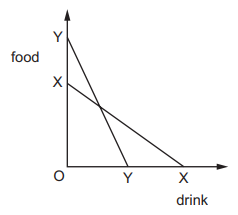
The diagram shows the change in a country’s production possibility curve from XX to YY.
What would explain this change?
1 )
Consumers chose to consume more food and less drink.
2 )
Government taxed food production and subsidised drink production.
Productivity rose in food production and fell in drink production.
4 )
There were more imports of food and more exports of drink.
تحلیل ویدئویی تست
منتظریم اولین نفر تحلیلش کنه!


پرسش و پاسخ های مشابه
سوال کنید یا به سوالات دیگران پاسخ دهید ...