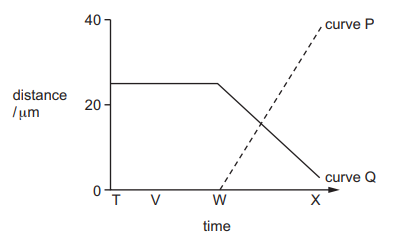
The graph shows how the distance between sister chromatids (curve P) and the distance between chromatids and centrioles (curve Q) changes during part of mitosis.
Which statements could be correct?
1- T to V represents interphase.
2- T to W represents metaphase.
3- W to X represents anaphase.
1 )
1 and 3
2 and 3
3 )
1 only
4 )
2 only
تحلیل ویدئویی تست
منتظریم اولین نفر تحلیلش کنه!


پرسش و پاسخ های مشابه
سوال کنید یا به سوالات دیگران پاسخ دهید ...