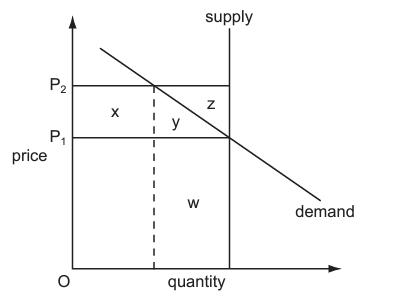
The diagram shows the market demand and supply curves for an agricultural product. The government allows the price paid by consumers to be determined by the market, but guarantees producers a price of $O{P_2}$.
Which area in the diagram represents the total subsidy payments made by the government to producers?
1 )
w + y + z
2 )
y + z
3 )
x
x + y + z
تحلیل ویدئویی تست
منتظریم اولین نفر تحلیلش کنه!


